Financial Highlights
GAAP Measures
| (in millions, except per share data) | 2019 | 2020 | 2021 |
|---|---|---|---|
| Revenue | 1,807.3 |
2,517.0 |
2,864.8 |
| Gross Profit | 623.0 |
813.3 |
957.3 |
| Gross Profit Margin | 34.5 |
32.3 |
33.4 |
| Net Income/(loss) | 121.4 |
(60.1) |
249.9 |
| Diluted EPS | 1.92 |
(0.82) |
3.31 |
| Operating Cash Flow | 178.9 |
354.8 |
528.4 |
| Capital Expenditures | 25.5 |
35.9 |
40.0 |
| Dividends Per Share | 0.84 |
0.85 |
0.86 |
NON-GAAP & OTHER OPERATING MEASURES
| (in millions, except per share data) (See included page on Disclosures Regarding Non-GAAP Measures and Other Operating Measures included with the Annual Report for a reconciliation of non-GAAP measures to the most directly comparable GAAP measures.)
|
2019 | 2020 | 2021 |
|---|---|---|---|
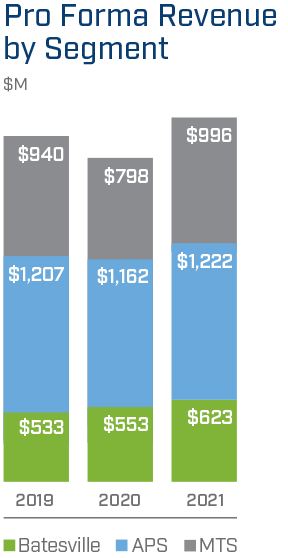
| Pro Forma Revenue | 2,679.5 |
2,512.3 |
2,841.3 |
| Pro Forma Adjusted EBITDA | 434.1 |
446.3 |
533.5 |
| Pro Forma Adjusted EBITDA Margin | 16.2 |
17.8 |
18.8 |
| Adjusted Diluted EPS | 2.80 |
3.19 |
3.79 |
| Free Cash Flow (Operating Cash Flow minus CapEx) | 153.4 |
318.9 |
488.4 |
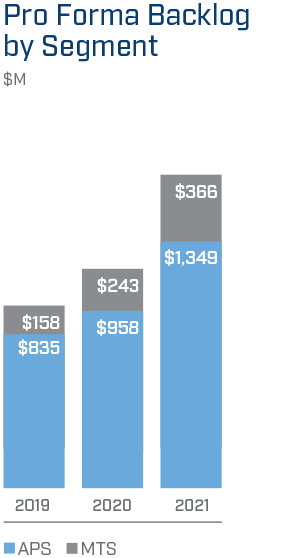
| Pro Forma Backlog | 992.6 |
1,200.2 |
1,715.0 |